Dashboard
The dashboard displays an overview of credits used, recent campaigns, list growth, and activity log. This will help you to monitor your credits, activities, and growth.

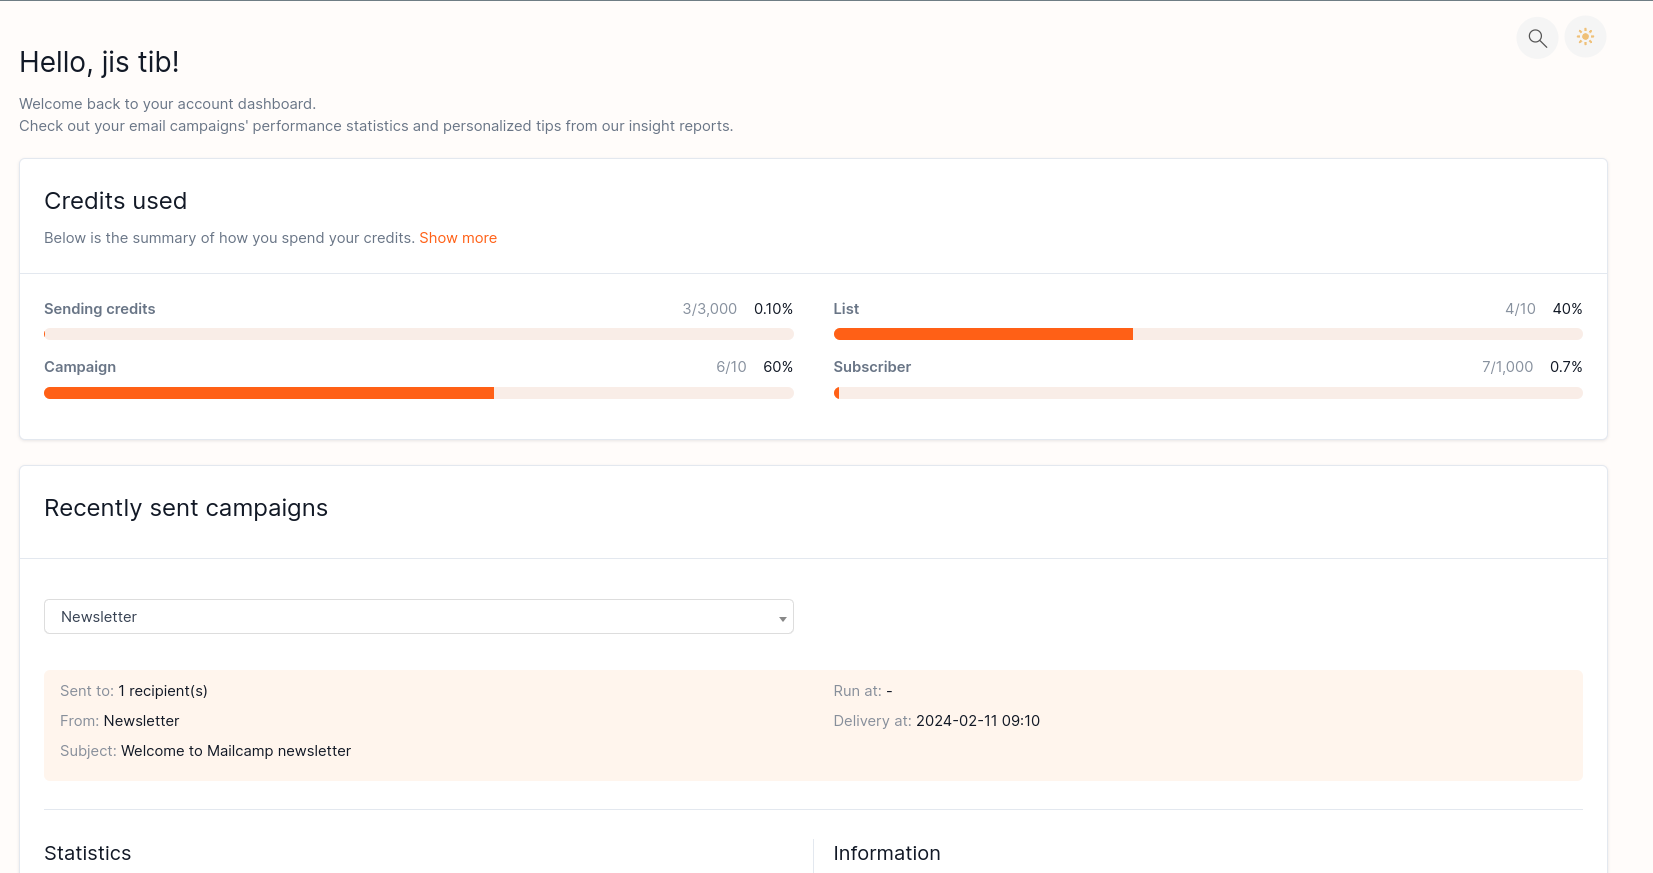
1. Credits used: Numbers of credits used from sending emails, creating a List, creating a Campaign, and adding Subscribers.
2. Recently sent campaigns: Shows the data of the recently sent campaigns on the dashboard. By selecting a campaign from the dropdown list, the data shown in the following sections will be shown accordingly.
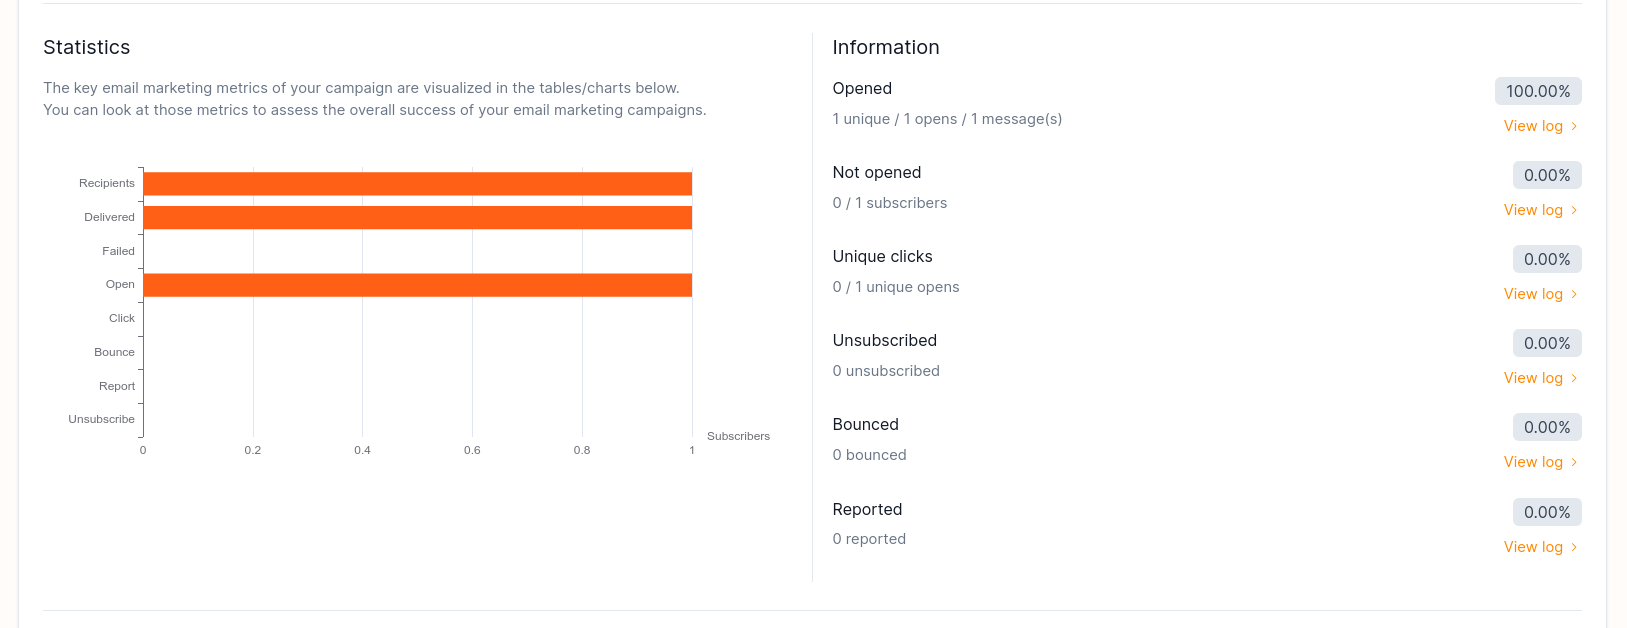
3. Statistics: The statistics shown in the graph are based on the selected campaign information. The statistics will show data about:
a. Opened
b. Not opened
c. Unique clicks
d. Unsubscribed
e. Bounced
f. Reported


4. Open rate: Open rates are based on the campaign email sent and opened by the subscribers. The open rate graph also shows information of:
- Successful deliveries
- Total opens
- Unique opens
- Last opened
5. Click rate: Click rate is based on the clicks on the linked embed in the email. The click rate graph shows the following information:
- Total clicks
- Total opens
- Abuse reports
- Last clicked
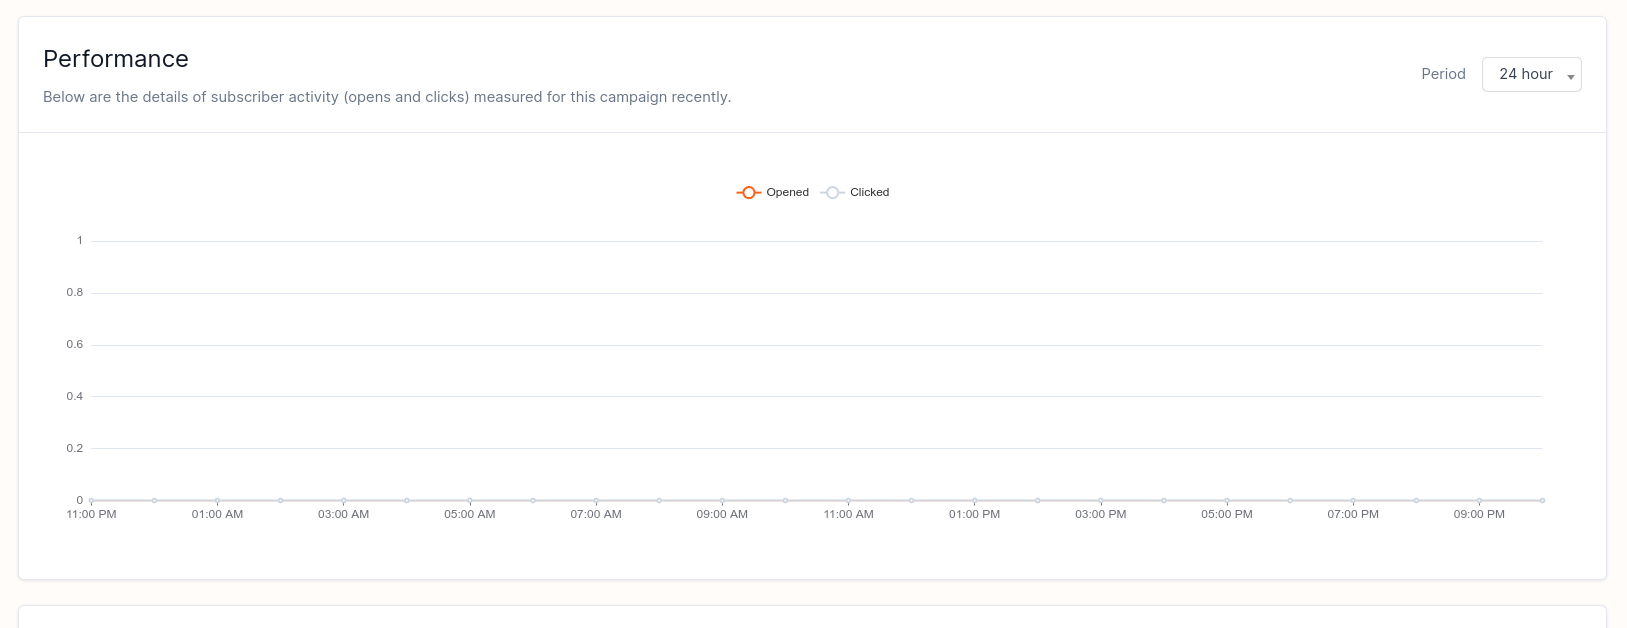
6. Performance: The performance graph displays the open and click rates of the selected campaign, indicating when the email was opened and when the link was clicked.

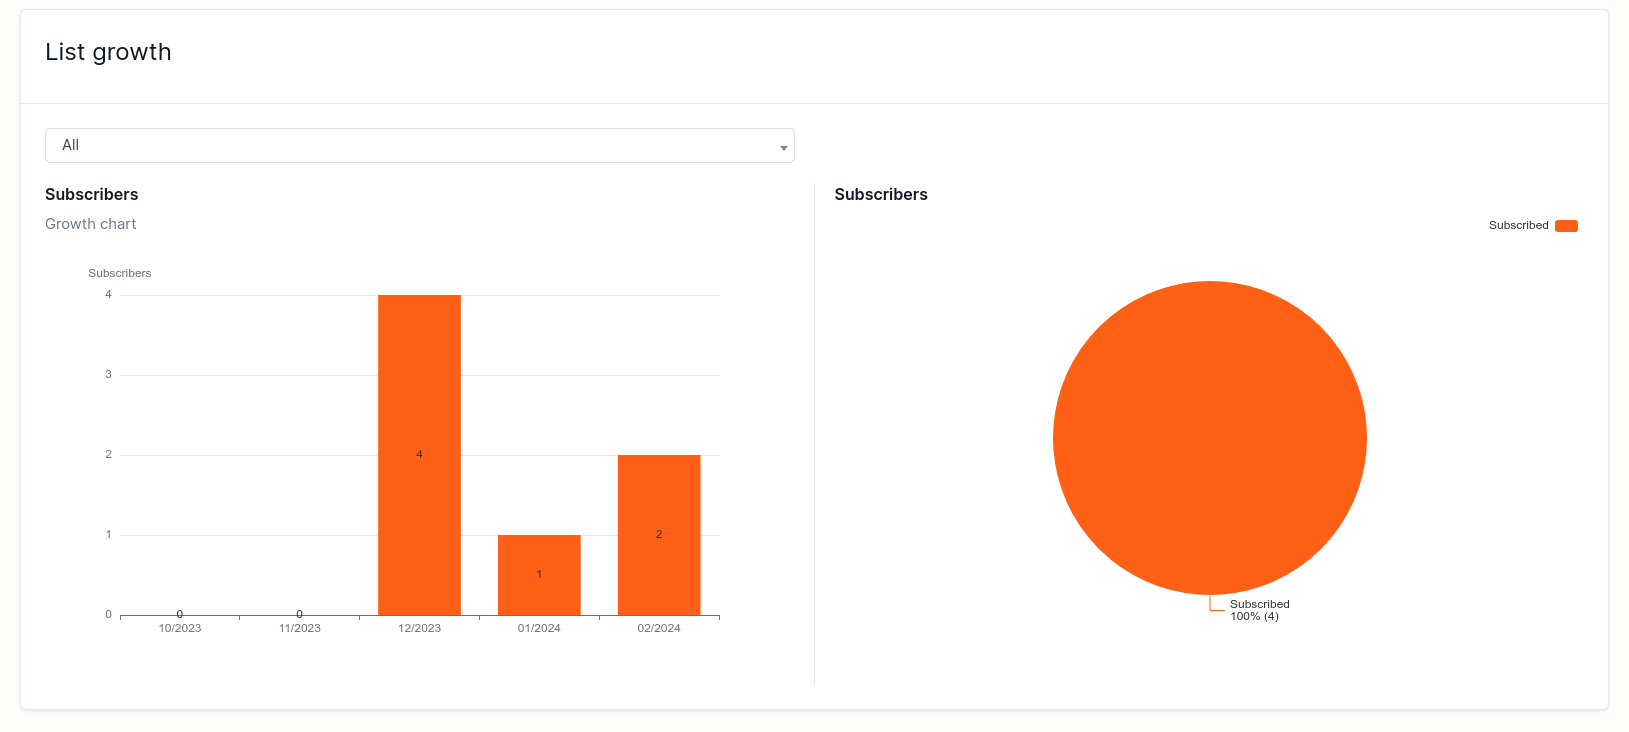
7. List growth: This shows your subscribers' growth from time to time.
8. Activity log: Logs your Mailcamp account activity and sorts from newest to oldest activities.
